Collective Behaviour in Animals
Jens Krause & Iain Couzin
Many species of group-living vertebrates exhibit complex and coordinated behaviours from the motion of fish soals and birds flocks, to herds of ungulates. Animal groups such as fishschools and bird flocks clearly display structural order, with the behaviour entity. Many of the collective behaviours exhibited by such groups can only be understood by considering the very large number of interactions among group members. In this context individual-based computer simulations are a very useful analytical tool to study such groups, and using this technique it has been possible to demonstrate that group leadership and global information are not necessary for collective animal behaviour (Huth/Wissel 1992).
Here we use a more biologically realistic model of aggregation behaviour that is based upon an abstraction of aggregation tendencies evident in biological systems (Krause/Ruxton 2002). Following the approach of Aoki (1982), Reynolds (1987) and Huth/Wissel (1992), we simulate the behaviour of individuals as resulting from local repulsion, alignment and attractive tendencies based upon the position and orientation of individuals relative to one another (Fig. 1).
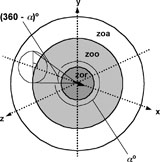
Fig. 1. Illustration of the different interaction zones in the model (zor = zone of repulsion, zoo = zone of orientation, zoa = zone of attraction) centred on an individual that is represented as an arrow. A possible ‘blind volume’ behind the individual is also shown. a represents the field of perception.
In our model the individual behaviour results in group formation and cohesion and the simulation exhibits characteristic collective behaviours, similar to those of natural groups, when certain parameters are changed (Couzin et al. 2002).
As the width of the behavioural zones (orientation and attraction) changes, the collective behaviour of the system exhibits sharp transi-tions between four collective dynamical behaviours (Fig. 2) which we have labelled as follows:
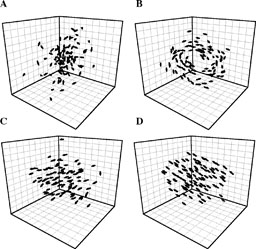
Fig. 2. Collective behaviours exhibited by the model: (A) swarm, (B) torus, (C) dynamic parallel group, (D) highly parallel group. The transition from (A) to (D) is a result of increasing the zones of orientation and attraction.
Swarm: an aggregate with cohesion, but a low level of polarisation (parallel alignment) among individuals. This occurs when individuals perform atraction and repulsion behaviours, but little or no parallel orientation (Fig. 2A). Torus: individuals perpetually rotate around an empty core. The direction of rotation is random. This attraction occurs when the zone of orientation is relatively small and the zone of attraction relatively large (Fig. 2B). Dynamic parallel group: the group exhibits high levels of polarisation. This type of group is much more mobile than the swarm or torus, and occurs at intermediate values of the orientation zone with intermediate or high values of the attraction zone (Fig. 2C). Highly parallel group: as the orientation zone increases, the group self-organises into a highly aligned arrangement with rectilinear movement (Fig. 2D). Swarm behaviour is often seen in different insect species, such as mosquitoes and midges (Ikawa/Okabe 1997), and can also be exhibited by fish shoals, particularly when foraging (Krause & Ruxton 2002). The dynamic parallel group exhibits many of the properties associated with aggregations such as bird flocks and fish schools; the individuals are polarised and move as a coherent group, but individuals can move throughout the group and density and group-form can fluctuate (Partridge 1982). The highly parallel group is much more static in terms of exchange of spatial positions within the group than the dynamic parallel group, and the variation in density and form is minimal. The torus formation may seem uncharacteristic of real animal movement within groups. However, this group-type is exhibited by natural schools of marine fish in open water including barracuda, jack and tuna (Parrish/Edelstein-Keshet 1999).
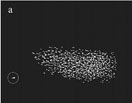
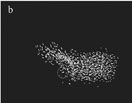
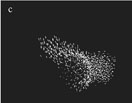
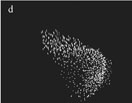
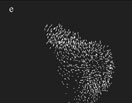
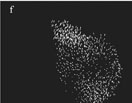
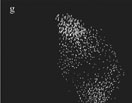
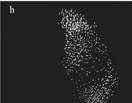
Fig. 3. Computer simulation of 1000 grouping individuals (white) responding to an attack by a predator (circle). Successive snapshots (a-h) of the simulation show how the group members respond to the predator attack.
Figure 3 shows the collective response of grouping individuals to an approaching predator. Similar behavioural patterns have been observed in schools of fish and flocks of starlings (Fig. 4).
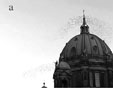
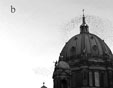
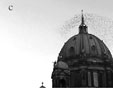
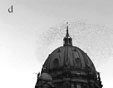
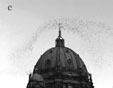
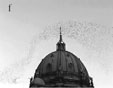
Fig. 4. Flocking behaviour of starlings at the Berliner Dom. The series of snapshots (A-F) shows the formation and subsequent break-up of a torus (see figure 2B for comparison).
So, what are the implications of such models for the flocking behaviour
of starlings in Berlin?
1. How is the flocking behaviour controlled? The model suggests that no leader is necessary. Each starling may just respond to a few flock mates in its vicinity.
2. What makes it so beautiful? What most people admire are the wave-like dynamic changes. As explained above, the information is transmitted on a local basis between neighbouring individuals in the flock and it takes some time for any behavioural change to be transmitted this way through the entire flock. This time-delay creates the wave-like appearance very much like in a Mexican wave in a football stadium.
3. Why do the birds never collide? The repulsion zone in the model ensures that the flock mates keep a certain distance from each other. The fast reaction times of birds make it possible for the animals to maintain these distances from each other even during fast flight.
4. Why do birds show such highly synchronised flight patterns? The highly synchronised grouping patterns in our model are a result of the interplay between the zone of attraction and the zone of orientation. Experimental work has shown that highly synchronised. grouping behaviour provides protection against predators because it makes it harder for a predator to single out any individual from the group.
Literatur
Aoki, I. (1982). A simulation study on the schooling mechanism in fish, in:
Bull. Jap. Soc. Sci. Fish. 48, 1081-1088.
Huth, A. and Wissel, C. (1992). The simulation of the movement of fish schools, in:
Journal of Theoretical Biology 156, 365-385.
Ikawa, T. and Okabe, H. (1997). Three-dimensional measurements of swarming mosquitoes: A probabilistic model, measuring system, and example results, in: Animal groups in three dimensions
(eds. Parrish, J.K. and Hamner, W.M.). Cambridge: Cambridge University Press.
Krause, J. and Ruxton, G. D. (2002). Living in groups. Oxford University Press, Oxford.
Major, P.F. & Dill, L.M. (1978). The three-dimensional structure of airborne bird flocks, in: Behavioural Ecology and Sociobiology 4, 111-122.
Parrish, J.K. Edelstein-Keshet, L. (1999). Complexity, pattern, and evolutionary trade-offs in animal aggregation, in: Science 284, 99-101.
Partridge, B.L. (1982). The structure and function of fish schools, in: Scientific American 245, 90-99.
Pitcher, T.J. and Parrish, J. K. (1993). The functions of shoaling behavior, in:
The behavior of teleost fishes (Ed. Pitcher, T. J.). London/Chapman & Hall, 363-439.
Reynolds, C. W. (1987). Flocks, herds and schools: a distributed behavioral model, in: Computer Graphics 21, 25-34.
Shimoyama, N., Sugawara, K., Mitzuguchi, T., Hayakawa, Y. and Sano, M. (1996).
Collective motion in a system of motile elements, in: Phys. Rev. Lett. 76, 3870-3873.